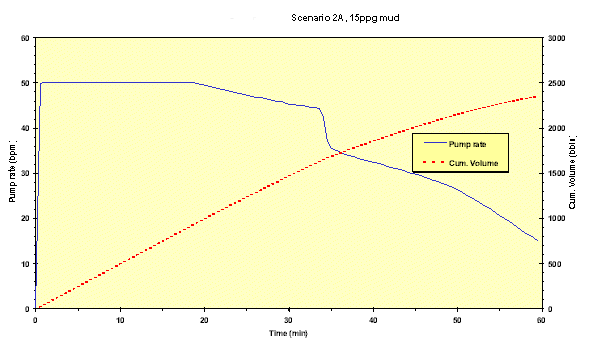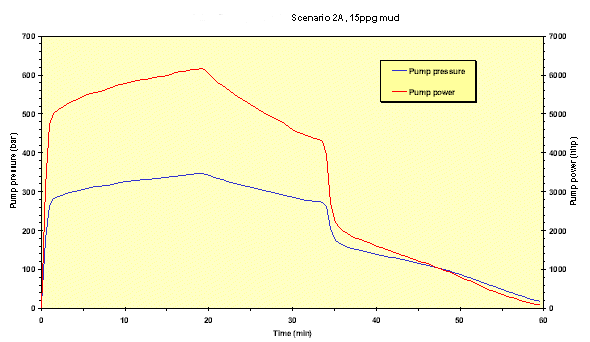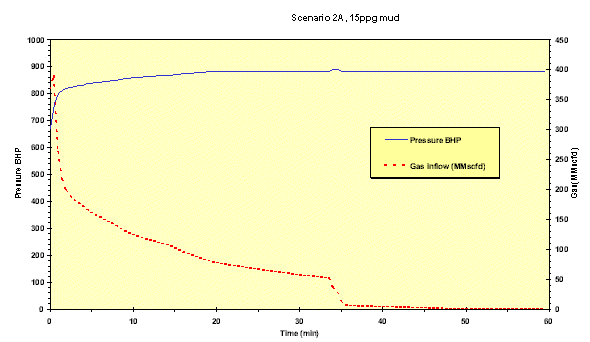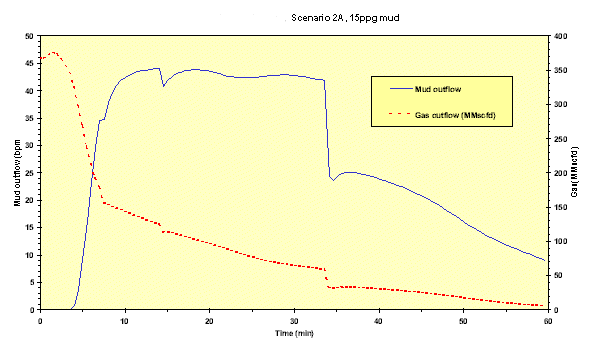
Blowout and kill simulation results are summarised in Table 5-1 to 5-4. An example of the corresponding results are shown in the following figures.
The figure is split into 4 plots as follows:
Shows the pumping rate and the cumulative volume of the kill fluid pumped.
Shows the pump power and the pumping pressure at wellhead for the simulations.
Shows the bottom hole pressure compared to the inflow rate from the reservoir.
This figure shows the oil, gas and kill fluid outflow at surface.

Figure
B.1a, Pump Rate and cumulative mud volume, Scenario 2a.
Relief
well kill using 15ppg mud.

Figure B.1b, Pump pressure and horsepower requirement,
Scenario 2a
Relief
well kill using 15ppg mud.

Figure B.1c, Bottom hole pressure and gas inflow (std), Scenario 2a.
Relief
well kill using 15ppg mud.

Figure B.1d, Gas and mud outflow at surface,
Scenario 2a.
Relief
well kill using 15ppg mud.