 Workscope. Mr. Smith, VP-Operations for Black Oil
Corporation (INC), requested John Wright of the John Wright Company (JWCO) to assist INC
to evaluate a course of action for cratered well, located in block 125. This well began
flowing gas uncontrolled early the same morning after the apparent rupture of the
9-7/8" casing and subsequent 13-5/8" and possible 20" strings. The flow was
observed through a sheared 4-1/16" side outlet and through numerous craters around
and in the cellar. This evaluation resulted in the conclusion that the only viable control
option was to drill a relief well to stop the uncontrolled flow. This report outlines the
strategic plan for the relief well.
Workscope. Mr. Smith, VP-Operations for Black Oil
Corporation (INC), requested John Wright of the John Wright Company (JWCO) to assist INC
to evaluate a course of action for cratered well, located in block 125. This well began
flowing gas uncontrolled early the same morning after the apparent rupture of the
9-7/8" casing and subsequent 13-5/8" and possible 20" strings. The flow was
observed through a sheared 4-1/16" side outlet and through numerous craters around
and in the cellar. This evaluation resulted in the conclusion that the only viable control
option was to drill a relief well to stop the uncontrolled flow. This report outlines the
strategic plan for the relief well.
John Wright and Jim Woodruff of the John Wright Company, as experts in relief well design, performed the analysis and this report documents the first iteration of the strategy. Dr. Ole Rygg of Well Flow Dynamics, an expert in multiphase flow, analyzed the hydraulic kill requirements with the use of the OLGA-Well-Kill two phase flow simulator. Dr. Steve Grindrod analyzed the surveying requirements. The results have been incorporated into the iterative design process. Halliburton Energy Services was contacted and provided information on directional drilling equipment, X wellbore survey data, kill plant equipment and pumping operations.
Background. The cratered well is a HPHT gas well. It’s objective was to evaluate Formations X&Y sequence of sandstones. After drilling ~2’ into the top of the X Formation at 18173’ MD/ 18167’ TVD and the dropping of a magnetic singleshot directional survey tool, the well kicked which ultimately resulted in collapse and parting of the drillpipe and loss of primary control. The wellhead pressure was in excess of 11,000 psi. Various control options where evaluated at this time from bullheading to relief well, but due to calculated risks (high temperature and excessive pressure) it was decided to put the well on emergency production and observe the pressures and flowrates over time. A detailed relief well contingency plan and bullhead hydraulic analysis was made by JWCO and submitted on April 20.
The gas is clean, consisting of approximately 95% methane, 3% ethane, 2% CO2 and nitrogen, there is no H2S. Water rate was +/- 70 bpd. The initial FWHP was in the order of ~10600 to 11000psi at a flow rate of ~35-40MMscfd and surface temperature of 220 F. The flowrate just prior to the casing rupture, on August 13, was reported at 44.5 mmscf/d at a FWHP of 8900 psi and 222 F. During production, +/- 6 months, the surface conditions remained mechanically stable.
Current Situation Cratered Well. While pressure was being bled from the 13-3/8" x 9-7/8" annulus (pressure was 3200 psi) a loud noise was heard coming from the cellar. Immediately this was followed by the observation of the entire BOP stack, wellhead and 20" casing moving upward and crashing into the substructure of the rig (a total vertical movement of +/- 15’). This movement sheared a horizontal flowline attached at a 4-1/16" flanged outlet releasing high velocity gas to the atmosphere. The BOP stack stayed in this vertical position for an indeterminate amount of time. Several hours later, after dawn, the stack was observed back on the ground. Gas flowing craters were observed around the rig for a radius of +/- 100 ft. The ground immediately around the rig appeared to be uplifted +/- 1 ft. The largest crater forming at the NW side of the substructure, facing the reserve pit. The majority of the gas appeared to be venting from this crater. No water or steam was observed from the vent at the side outlet, small amounts of water were observed in the large vent in the form of chunks of X surface soil being thrown into the air out of the vent. The rig was listing +/- 15 degrees to the NW.
A local safety company was immediately called in and secured the area. LEL readings were monitored at various areas around the location. Blowout firefighters were called to evaluate control options. They concluded that a relief well would be required for control and declined to attempt rig removal. Wilfred Baker Engineering was called in to evaluate the fireball and subsequent overpressure hazards associated with accidental or voluntary ignition.
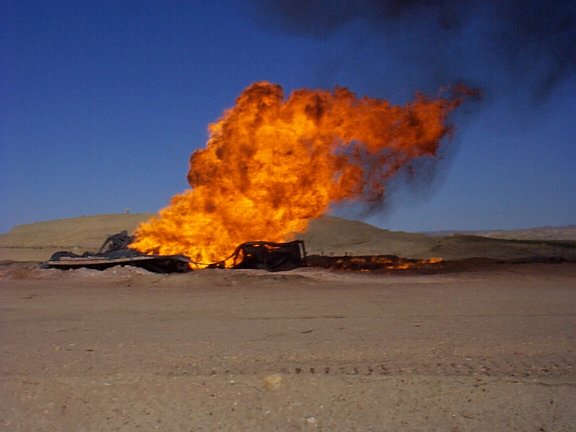
Due to limited emergency production options, no surface control options and potential accidental ignition hazards (an active railroad track runs just west of the location) INC management determined the venting gas would be voluntarily ignited for safety reasons. The pros and cons of attempting to move the rig off the wellhead before ignition were evaluated. Five plus days were estimated as the time required to remove the rig. After evaluating risk/consequence of moving the rig INC management determined the gas would be ignited with the rig in place.
The gas was ignited using a 12 gauge shotgun with flare cartridges from a safe upwind distance. Seven shots where reportedly required before ignition was achieved. The fireball was contained to the immediate rig area with only minor shock wave reported by witnesses. The sustained fire was estimated as 40 to 70 ft high and 100 ft in diameter. The rig substructure collapsed to the NW in approximately 43 minutes. A video was taken of the ignition from two prospectives.
Method of Analysis. The relief well design method utilized in this investigation reflects the planning strategy the John Wright Company has developed and refined over the past 15 years. The relief well strategic planning process is based on an iterative procedure. This report is the result of the initial phase of the design for the X relief well intervention project.
The "design process" steps, in generic terms are the following:
Click here to see Relief Well Planning Flow Chart
Results of Analysis 4.1 Gather Relevant Data. Some key well/reservoir data are found below.Table -1 Well & Reservoir data
Reservoir depth, X |
ft tvd |
18 173 |
Initial Reservoir gradient, X |
ppg |
14.9 |
Initial Pressure, reservoir |
psi |
14 067 |
Reservoir depth, 1st Y |
ft tvd |
17 058 |
Reservoir gradient, 1st Y |
ppg |
14.9 |
Pressure, reservoir |
psi |
13 204 |
Reservoir temperature, |
�F |
290 to 310 |
Initial open flow potential, estimated from X zone, gas |
MMscfd |
340 |
Initial GWR |
Sm3/Sm3 |
98900 |
Flowing fluid.
The well is producing a gas with ~95% methane and some associated and free water. The gas density at standard conditions is 0.7084 kg/m� or 0.58 sg (rel air).Table -1 Composition of produced gas
| Fluid composition | Gas |
|
| Component | mole % |
|
| nitrogen | N2 |
0.690 |
| carbon dioxide | CO2 |
1.260 |
| hydrogen sulfide | H2S |
0 |
| methane | CH4 |
94.950 |
| ethane | C2H6 |
2.960 |
| propane | C3H8 |
0.100 |
| iso-butane | iC4H10 |
0.020 |
| n-butane | nC4H10 |
0.020 |
Gas production. Figure 1.1 show the gas production, measured flowing wellhead pressure and the water rate. The initial production of 40 MMscfd was reduced to 25 MMscfd due to high content of water for gas sale production. The gas rate was later increased to 35 MMscfd. In early May the rate was again increased to about 44 mmcfd and kept constant until the day of well rupture. The water production increased also slightly at this point with an average of 160 bwpd estimated. The water production is believed to be condensed water (approximately 75%) and free water coming from the Y zones.
Figure 1 also shows the wellhead pressure during the production period. The wellhead pressure decreases from the initial 11150 psi to 8900 psi at the time of the blowout. The wellhead pressure drop is believed to be due to reservoir depletion.
Figure 1 Gas production until time of blowout.
4.2 Initial Onsite Assessment. Initial observations, by two witnesses, report the entire BOP stack, wellhead and 20" casing were projected upward with great force into the underside of the substructure. Damage to the substructure and sheared flowline, at a side outlet flange, support this observation. The stack reportedly stayed in this position for a short time and then settled back down to near its original position. Clean gas was venting at high velocity out of the 4-1/16" side outlet and numerous vent holes around the wellhead. The largest vent was just outside the NW side of the substructure (+/- 15 ft from the wellhead), the farthest observable vent (small amount of bubbling) was in the reserve pit (100+ ft to the NW of the wellhead). Other smaller vents were observed in the cellar, and on the NE and east side of the substructure. A pressure reading taken off the choke manifold (open to the wellhead) indicated low flowing pressure inside the wellhead (pressure reading +/- 30 psi with a 0 to 5000 psi gauge). Production data prior to the incident were: 44.5 mmscf/d @ 8900 psi FWHP. Pressure was being bled off the 13-3/8" x 9-7/8" annulus which had climbed to 3200 psi when the rupture occurred.
4.3 Diagnostics. For the BOP stack to move 15 ft vertically, while still attached to the wellhead and 20" casing, would require the complete severing of the 9-7/8" and 13-5/8" casing strings. The 20" casing, set at +/- 352 ft and cemented to surface, may have severed or pulled the entire 20" string with the wellhead. The location of the severed pipes is unknown but above the estimated TOC on the 9-7/8" x 13-5/8" annulus at 7000 ft. One theory is the 9-7/8" may have parted at the same depth as the severed drillpipe (which parted during the original well control incident in February). This induced by mechanical wear by flow erosion and/or wear by vibrating pipe end. The exact depth of the drillpipe severe is unknown but is thought to be between 3000 and 4000 ft by INC based on pump tests after the pipe parted. The top of the bottom drillpipe fish may have additionally cork screwed down the hole some unknown distance.
As the 9-7/8" casing burst the 9-7/8" x 13-5/8" annulus (which is cemented to +/- 7000 ft) immediately saw 8900 psi and the 13-3/8" burst (which would have the highest loading near the surface) probably above the 20" shoe at 352 ft. At this point the force from the pressure x cross section would only be held by the 20" cement and the combined weight of the casing, drillpipe and BOP stack. This force was great enough to lift the entire mass and slam it into the substructure. If the 13-3/8" burst below the 20" shoe it would be less likely to hydraulic the BOP stack into the air, as fracture to surface would occur almost immediately.
4.3.1 Well flow diagnostics. The wellhead pressure during the emergency production from March until the day of the rupture has dropped from 11134 psi to 8909 psi. The gas production in the same period was an average of 36 mmcfd for the two first months and increased to 44 mmcfd for the last for months. The water production in the same period increased from 80bwpd to 160bwpd of which a major part has been estimated to be condensed water.
Correlated with two shut-in tests carried out on May 29 and June 6, the initial static reservoir pressure was calculated to drop from the 14067 psi (14.9ppg) when taking the initial kick in February down to 11450 psi (12.13ppg) at the time of the rupture.
INC calculated the projected reservoir depletion of the X reservoir zone 90 days from rupture to be 2400 psi, 3450 psi and 4250 psi based on an average loss of reserves of 100 mmcfd, 150 mmcfd and 200 mmcfd respectively. This will reduce the estimated reservoir pressure to the corresponding 9050 psi, 8000 psi and 7200 psi on the projected day of the relief well intersection and subsequent kill. The flowing bottom hole pressure will be even lower, in the range from 4750 psi to 3600 psi.
Based on these calculations, the total outflow of gas at surface when assuming no restrictions (total rupture) appears to be around 180 mmcfd at August 12, and drops off to 100 mmcfd at the time of intersection depending on depletion. These numbers appear to be on the conservative side judging from the flow of gas seen at surface of cratered well. But visual observations of gas flow through surface ruptures are often unreliable and additional flow path obstructions, both due to parted drillpipe in the well and surface restrictions, might be present. The pumping of kill fluid from the relief well could potentially open up some of these restrictions during the kill process, and a conservative approach is therefore preferred with respect to the outflow rate estimate.
Pressure prognosis. The main inflow zone, X, and the higher Ys appear to be naturally fractured. For the simulations a high productivity is therefore assumed. The flowing bottom hole pressure at the inflow zones will therefore be fixed by frictional and static pressure drop inside the flowing wellbore. Based on data from nearby wells the pore pressure and fracture pressure throughout the flowing zones (i.e. from 17 058 to 18 175 ft) are assumed to be 14.9 ppg and 16 ppg respectively. The resulting absolute pressures and gradients in the different zones are presented in Figure 2 and 3.
Figure 2 Estimated pore pressure with depletion estimates.
Figure 4 Estimated reservoir pressure and projected reservoir depletion.
Reservoir inflow. Only limited data exists that can be used to estimate the reservoir inflow parameters, such as average porosity, permeability and the net pay interval of the flowing zones.
The simulations were defined with an injectivity based on the drawdown calculated for flow both in annulus and drillpipe with 40 MMscfd gas flow rate (i.e. 14 067 psi – 13 210 psi = 857 psi), see previous report on "Down hole flow diagnostic and bullheading analysis", reference 1.
Matching an inflow production curve to these data can give the inflow relationship shown in Figure 5. This inflow performance is used for the full open blowout to surface giving an outflow 250 mmcfd when the well control started in February reduced to 180 mmcfd on the time of the rupture due to depletion, see section 1.5. The open flow potential is reduced further until the projected day of relief well intersection as shown in Figure 5.
Please note that the inflow estimates are based on limited data of the reservoir zone and a conservative approach with respect to inflow estimates is therefore recommended.
Figure 5 Estimated gas inflow from X zone.
Flowing temperature. The reservoir fluid in the X zone is expected to have a temperature in the range from 290� F to 310� F, resulting in a flowing temperature at surface of approximately 200-225� F depending on rate. The temperature measurements at surface are taken at the wellhead and are believed to be relatively uncertain, and are therefore not directly used in evaluation of the down hole flow conditions. The fluctuations seen on the temperature curve is due to day and night variations. The increase in temperature also reflects the water cut throughout the period.
Figure 6 Temperature at wellhead, gas and water production.
Down hole flow path. A detailed study of different potential blowout flow paths was presented in the report prepared in March.
Based on the flow conditions seen at surface we assume flow is coming from the X up a fully open annulus to surface. Flow is also through the drillpipe and out into annulus assuming parted and open drillpipe at 3000 ft. This is also a conservative approach with respect to the total outflow rate.
Additional work will be required on studying the down hole flow conditions in detail prior to the relief well kill intersection. The flow inside the drillpipe can potentially influence the final kill operation by making a flow path for the gas, inside the mud column. It might be required to drill through the drillpipe or perforate to be able to get the #1-29 well statically killed.
4.4 Relief Well Constraints
4.4.1 Surface Constraints to Rig Placement. Two rigs were drilling in the same field as the cratered well. Both of the these well were evaluated for conversion as a relief well. The first was well, located +/- 4410 ft to the southwest, and the second well, located +/- 3850 ft to the northwest. Both of these rigs were drilling vertical hole just at the 20" casing shoe. Both of these locations were evaluated and proved acceptable based on trajectory constraints for intersection with the cratered well below the 9-7/8" casing. Using one of these locations could potentially save +/- 45 to 60 days from building a new one. Constraints for a new location are: surface topography, a railroad track to the north, and prevailing wind from the west.
4.4.2 Geologic Considerations. The broach of the cratered well is close enough to the surface that underground supercharging of shallow formations is not considered to be a hazard. For drilling considerations, it is desired to set the 13-3/8" casing below the vertical dipping shales. The top of this formations is reached at +/- 5200 ft on the first well and at +/- 7500 ft on the second well. The farther proximity of the first well requires a kick-off at 5500 ft to reach the desired intersection depth with maximum 3�/100’ build and 1.5�/100’ drop. The second well due to its closer proximity can reach the desired intersection point with lower build and drop rates than the first. Three or more fan type faults would require penetration during the drop if the first location was chosen. This feature is known to cause severe directional control problems. The trajectory from the second location avoids these faults. The Y sandstone sequence, from 17,060’ to 17,630’ is gas bearing and a problematic loss of circulation zone consisting of massive fractures. The primary flowing reservoir (X) is also massively fractured. The temperature at the 9-7/8" shoe is estimated to be +/- 260� F and the top of the X is +/- 300� F.4.4.3 Position uncertainty of cratered well. Cratered well was drilled as a vertical well, however, due to strong formation tendencies to build angle extensive motor work was required to maintain a low inclination. Magnetic single shots were utilized from surface to 402’, MWD was used from 420 to TD. Hole sizes were 17-1/2" to 8641’, 12-1/4" hole from 15,448’, 8-1/2" hole to TD. No north seeking gyro surveys were taken. To estimated the borehole position uncertainty of the cratered well requires a judgement call on error sources relative to the individual MWD surveys taken at depth. These error sources include, e.g.; relative depth error, sensor accuracy, calibration errors (e.g. magnetometer and accelerometer bias and scale factors over temperature), misalignment of sensors to the MWD housing, misalignment of the MWD to the wellbore axis, flexure of the MWD housing, magnetic interference (e.g., BHA, hot spots on MWD housing, motor, external source), depth and azimuth reference system (e.g. magnetic declination error, depth reference in error), etc. In near vertical wells the majority of position uncertainty is caused by inclination and misalignment error.
Many of the surveys taken in the cratered well were taken behind directional bent housing motors which may introduce a larger sensor misalignment to the wellbore axis than would be experienced with a rotary BHA. However, due to the large number of survey stations taken a different tool face positions with different MWD tools in different hole sizes, the systematic effect of individual readings tends to become random over the course of the entire wellbore.
Assuming this to be correct and the MWD tools are within manufacturers specification and were operated using standard QA/QC procedures, the estimated uncertainty of the cratered well bore will be on the order of 1.1ft/1000ft of along hole depth (at one standard deviation). This would translate to an uncertainty of +/- 16.5 ft (one sigma or +/- 43 ft for 95% CI) at the ranging depth.
Dr. Steve Grindrod is checking the raw data from the MWD surveys to determine if this assumption is correct or if the uncertainty cone requires expansion.
4.5 Primary and contingent relief well kill objectives. The primary kill objective chosen for this plan is a direct intersection in the cratered wellbore followed by a standard hydraulic kill using weighted mud. If this process proved unsuccessful, contingent methods would be: (1) staged kills using heavier muds followed by lighter static kill muds: (2) a two part reactive plug kill, one part pumped down drillpipe and second part pumped down annulus; or one followed by the other with a spacer down drillpipe (e.g., DOBC gunk and mud or sodium silicate and cement). (3) Dynamic kill using water, followed by static kill mud (if the flowrates and pressures are sufficiently drawn down).
4.6 Kill point(s). The primary kill point is in the open wellbore below the 9-7/8" shoe of the cratered borehole, by a distance of +/- 200 ft (+/- 15,600’ tvd relative to cratered rkb). Contingent kill points are deeper, but above the Y formations (+/- 16,800’), and finally below the Y and above the top of the X formations (+/- 18,000’). A high kill point was below the 13-3/8" shoe was also evaluated (+/- 9000’ was also evaluated).
4.7 Primary and contingent methods for hydraulic communication. Primary - direct intersection in cratered well open hole annulus with relief well bit. Contingent - sidetrack. If flow is going through the drillpipe as well as the annulus and mud cannot be easily circulated through the pipe from the proposed intersection point, then the drillpipe may have to be penetrated (either with perforating guns or mills).
4.8 Attack angle and proximity at kill point. Direct intersection required with both primary and contingent communication methods. The relative attack angle (angle between cratered and relief well at intersection depth) is planned at 3-5�. A high kill point would require a parallel intersection and either milling or perforating into the cratered well casing.
4.9 Electromagnetic ranging. Basic ranging strategy for primary and contingent kill targets is to use electromagnetic instruments for a triangulation bypass and drop to vertical without a plugback. Initial ranging zone is at a center to center distance of 130’ proximity from relief well to 1-29 (+/- 14,165’ tvd). This will be in an oil base mud section. Additional ranging fixes (9-18) will be required to make final intersection depending on the relative position of the two wells.
Background Information. The recommended primary casing locating and search instrument to be utilized on this project is an electromagnetic ranging tool. This instrument has a maximum range of approximately 150’ under the proposed conditions (resistivity +/- 7ohm-m). The predicted position uncertainty of well cratered well is within this range, however, the relief well trajectory selected must be capable of reaching an intersection target at the outside edges of the uncertainty zone. Of prime concern is sufficient TVD for performing directional steering to the intersection point after the cratered wellbore has been located.
Therefore, the primary factors in the initial search point will be relief well position uncertainty, formation drillability, drilling fluid type and electrical conductivity, the required directional path below the search point (i.e., will the well be plugged back and sidetracked, or continue in a parallel approach), and the end point of the casing/drill pipe.
It is normally desirable to search at least 1000’ TVD above the kill point (more depending on the position uncertainty) to allow enough depth for course corrections. Additionally, this generally allows the blowout casing to be triangulated before setting casing on the relief well. The items normally evaluated in establishing the casing search point are:
Also, a "bypass" is recommended to (1) ensure locating the target casing and (2) initially reduce the relative borehole uncertainty of the blowout due to ranging tool uncertainties.
See Vector Magnetics brochure. Logging may be required every 24 hours to 36 hours during the bypass and drop to intersection. A 7-conductor wireline truck should be dedicated as much as practical to the project during these times (if possible with dual drums with one single conductor for running the gyros). Click here to see example plan view electromagnetic bypass.
Click here to see vertical section view of bypass
4.10 Surface location(s). Relief well trajectories were evaluated using 2 surface locations and the 15,600’ tvd intersection target. A third location located 1500’ due west (just for trajectory purposes) was also evaluated for a shallow intersection at 9000’ tvd. After careful evaluation of the trajectories the second location was chosen as the primary relief well.The relative surface location between relief well and cratered well was resurveyed by Siek Surveying Service. This survey was made using a local grid system with a true north reference determined in the field from solar observations.
The azimuth was not critical as the target wellbore is basically vertical at the zone of interest. The relief well trajectory crosses the 1-29 casing at +/- 15,350’ MD/14,412’ tvd at +/- 5� Inclination at a distance of +/- 10’ to the southwest (this assumes the relative proximity to the blowout wellbore is as surveyed). The relief well will be nudged in the 17-1/2" hole at +/- 5150’ at 0.5�/100’ building to +/- 16� Inclination and +/- 120� azimuth at the 13-3/8" shoe (+/- 7500’ tvd). The well will continue to build at 2�/100’ up to 31� Inclination at +/- 8300’ MD and then hold for +/- 5000’ and drop at 1.25�/100’ to the first electromagnetic ranging depth at +/- 15,250’ MD/ 14165’ tvd.
The trajectory, from here to intersection, will be based on the relative position of the blowout wellbore to the relief well. If the blowout position is as surveyed, the relief well will continue to drop to vertical at +/- 15,750’ md/14,800 tvd. The relief well will then parallel the blowout well bore to +/- 15,235’ tvd and then nudge toward the kill target at 2�/100’. The inclination will be 3� to 5� at the end of the build (+/- 15,400’) and should be pointing directly at the kill target at +/- 15,600’ tvd. The 9-7/8" casing is planned to be set at the end of this build/turn section. Slight corrections may be required in the 8-1/2" hole section to achieve final alignment. Intersection is planned with a rotary assembly.
Click here to see relief well trajectory vertical section view
The basic casing plan is to set 13-3/8" intermediate casing at +/- 7500’ tvd at +/- 16� inclination. The planned kill string is 9-7/8", 62.8 ppf, TAC-140, with New Vam connections. This string is planned to be set approximately 200’ above the intersection point at +/- 16,345’ MD/15,400’ tvd. A 7" liner will be used as a contingency kill string if necessary..
4.13 Survey program. The surveying criteria for this relief well will be critical if sidetracks are to be avoided. The initial ranging zone is just inside the 99% confidence interval for the combined survey uncertainty of the relief well and blowout and the maximum search radius of the Vector Magnetics ranging instruments. This will require surveying techniques and instruments to minimize the position uncertainty of the relief well from surface to the first ranging depth of +/- 15,250’ MD. The proposed intersection scenarios require continuous steerable motor work in 3-D space from the ranging zone to the intersection. This will require good quality control of the MWD data with cross checks made with a through drill pipe north seeking gyro. A surveying specialist (Dr. Stephen Grindrod) will be on location during critical phases to define surveying procedures (in conjunction with the service company, HES, SDC or Gyrodata) based on the type of instruments used (MWD or gyro) and QA/QC criteria for data acceptance.
It is extremely important to fix as accurately as possible the relative positions between the blowout wellhead and the relief well. This was done by a local Surveying Service on August 15 using conventional land surveying techniques (e.g., precision theodolites and laser range finders). An independent north reference fix was also made using solar observations.
The local magnetic field was also measured using a precision magnetometer theodolite. This was performed to determine the onsite magnetic: declination, dip angle, and total field values. Two or three true north reference bench marks are being set in the area of the relief well site (at least 100 m from any steel pipe lines or steel surface objects) and will be used to monitor the local field during the course of the project.
After the blowout casing has been located with the electromagnetic ranging instruments, several additional pipe trips may be required to survey the bottom of the hole. This is necessary as the survey sensor in the MWD tool is too far behind the motor and bit (+/-50’) to drill to the kill casing setting depth (intersection) without checking the actual hole orientation at the bit.
Basic Surveying Program
Drilling 17-1/2" hole to 13-3/8" casing setting depth: MWD using MAC1 drillstring correction software.
13-3/8" casing after shoe is drilled out: Gyrodata north seeking gyro survey inside casing (7545’). Two radio active tags will be placed in the casing string (one at +/- 5000’ and the other above the float collar) for depth referencing the gyros with a gamma ray.
12-1/4" hole: MWD using MAC1/MAC3 correction software. NMDC will include a 15’ pony between MWD and motor and a full 30’ NMDC above the MWD. Sensor spacing will be approximately 40% up from the bottom of the pony NMDC. Check shots will be made going in and coming out of the hole at +/- 7700’ MD (compared against drillpipe gyro) with possible in-hole referencing to the gyro azimuth.
Through drillpipe north seeking gyro at the end of the build section (SDC). This survey will be run through the drillpipe after the angle is built to 31� at a depth of approximately 8400’ MD. This survey will be run in the high speed mode back surface and compared with the Gyrodata casing survey. Additional stations will be made at the MWD check point at +/- 7700’.
Through drillpipe north seeking gyro at +/- 12,500’ MD. This might be done with SDC or with Gyrodata drop gyro at a bit trip before the PDC bit goes in the hole.
4.14 Kill hydraulics.
Simulations of the blowout scenarios give estimates of the gas rates and flowing bottom hole pressures. These simulations also define the starting point for the kill simulations.
The blowout rates for the well scenarios studied are a function of both the flow path restrictions, reservoir productivity and flowing fluid type in these simulations. The results are included in Table 3-1.
Relief well kill simulations. For the kill simulations, pump rate is controlled, and the full dynamic kill operation is simulated. Pump rate is governed by controllers set on bottom hole pressure, maximum pump pressure and pump rate. The controller on the bottom hole pressure was set to a target pressure just above the reservoir pressure.
This is done in the same way that an actual kill job would be controlled, by monitoring the pressure using a water filled drillpipe, or a similar arrangement, to avoid fracturing and losses during the kill operation. Opening a "choke" at the bottom of the relief well simulates the intersection between the wells.
The simulation runs for these wells were set up as a network, with branch 1 as the relief well, branch 2 as the lower section of the blowout well below the kill point, and branch 3 as the upper part of the blowout well.
Kill fluid. Several different kill fluids can be used in the kill process. Water, brine or drilling mud can potentially be used for dynamically killing a blowout from this well. For the simulations presented, 15ppg and water are used as kill fluids.
Higher mud weights may be advantageous, but can lead to fracturing at the kill intersection point with subsequent high losses. The higher mud weights on the other hand give advantages with respect to a reduction in kill rate.
If unloading of the blowout well appears to be a problem in the process of getting the well stable, higher mud weights might be an option to achieve stable well an proceed with cementing.
Water is often used initially to check on communication with blowout well. For the ongoing uncontrolled flow to surface pump rates, pressures and power requirements for full dynamic water kills may be impractical for the initial dynamic kill operation, but may be used as a backup if high losses of mud is experienced resulting in pumping away all mud available. The water will then be pumped at a low rate down the relief well annulus to prevent gas for migrating up the relief well.
Relief well kill intersection. Based on the moderate kill pumping requirements and to avoid drilling to the potentially fractured and possibly depleted Y zones, the planned relief well intersection point is below the 9 7/8" casing. The 9 7/8" casing shoe of the relief well will be set above the 9 7/8" casing shoe of the blowout well. An open hole intersection through 8 �" hole will be used from the relief well. For open hole intersections, all the equipment and procedures needs to be ready to pump on making intersection.
Well kill summary. Table 3-1 summarizes the relief well kill simulations for pumping using 15ppg mud or seawater. The dynamic kill using seawater is included for reference only and is not planned used for the initial dynamic kill operations. The simulations are defined pumping down the relief well annulus, assuming the relief well drillpipe is used for monitoring of pressures.
As can be seen from the summaries, the kill pumping requirements are reduced from the initial estimates from March due to the estimated depletion of the X reservoir zone. After stopping inflow from the reservoir, the section below the kill point as well as the upper part of the well must be circulated and/or bull-headed free of gas. Both simulations and experience show that this normally takes 2-3 hole volumes after inflow stops, in order to prevent the blowout from restarting.
When the outflow stops, cement can be pumped to block the blowout well path. Pumping LCM additives are recommended used to reduce and subsequent stopping losses, but decisions will be made during the kill pumping operation based on the pressures and losses experienced. The estimated volume to stop the reservoir inflow is 2500 bbls assuming a depletion rate of 100mmcfd. For circulation to remove all remnant gas, three hole volumes of the blowout well (1000bls) is recommended. With an excess volume of 2500 bbls, the volume required adds up to a total of 9000 bbls of water based mud. As a minimum 6000 bbls should be available before intersection.
The required pump rate and volume might be reduced upon relief well kill intersection if higher depletion is observed. A refined estimate of the total volume of mud needed to be prepared upon relief well intersection is therefore recommended closer to the time of intersection. Click here to see a vertical section summary of well intersection and kill.
Table -2 Relief well kill requirements for kill intersection below the 9 7/8" shoe
Case |
|
|
||||||
Reservoir |
FBHP psi |
Max
Gas |
Kill |
Pump |
Pump |
Mud |
Pump |
|
|
||||||||
0a |
14067 |
7200 |
250 |
15ppg mud |
75 |
6500 |
4000 |
12000 |
0b |
14067 |
7200 |
250 |
water |
no kill |
- |
- |
- |
|
||||||||
1a |
11450 |
6260 |
185 |
15ppg mud |
55 |
4100 |
3000 |
5500 |
1b |
11450 |
6260 |
185 |
water |
no kill |
- |
- |
- |
|
||||||||
2a |
9050 |
4750 |
140 |
15ppg mud |
40 |
<1000 |
2500 |
<1000 |
2b |
9050 |
4750 |
140 |
water |
85 |
8100 |
3500 |
17 000 |
|
||||||||
3a |
8000 |
4090 |
115 |
15ppg mud |
30 |
<1000 |
2000 |
<1000 |
3b |
8000 |
4090 |
115 |
water |
75 |
5200 |
2250 |
9600 |
|
||||||||
4a |
7200 |
3600 |
100 |
15ppg mud |
20 |
<1000 |
1000 |
<1000 |
4b |
7200 |
3600 |
100 |
water |
65 |
3600 |
2000 |
5800 |
|
||||||||
5a |
5000 |
2125 |
70 |
15ppg mud |
15 |
<1000 |
800 |
<1000 |
5b |
5000 |
2125 |
70 |
water |
30 |
<1000 |
1000 |
<1000 |
#) to stop inflow, additional volume required removing all gas (see discussion in text.)
Relief well kill pumping operations. Losses at the kill point are assumed negligible in these simulations. Losses can be high, especially in the Y zones and this will be studied in more detail prior to the relief well kill intersection.Dynamic kill simulation results for pumping 15ppg mud down the relief well annulus are shown in Figures 8 through 11. The presented results are for blowout rate estimate at the time of rupture. Similar results are available for all simulations presented in Table 3-1.
Each result is split into 4 plots as follows: 8) Shows the pumping rate and the cumulative volume of the kill fluid pumped. 9) Show the pump power and the pumping pressure at wellhead of the relief well for the simulations. 10) Shows the bottom hole pressure in the X zone compared to the inflow rate from the X reservoir. 11) This figures shows the gas outflow and kill fluid outflow at surface, either produced or flowing uncontrolled out at surface.
One of the components of the relief well planning process is the evaluation of the required number of relief wells. The process for making this evaluation is to first define the technical requirements for multiple relief wells. If it is determined that one relief well is technically capably of controlling the well the next step is a risk management exercise which evaluates the probability of success, over given time periods, verses economic and HSE consequences if the single relief well fails or is substantially delayed due to mechanical problems or changes in the blowout situation. This is an iterative process, which next evaluates the probability of success, over a given time period, if two relief wells are started verses the addition cost and resources required for an additional well, traded-off against reduced economic and HSE consequences for a single relief well failure or delay.
Technical Requirements. The technical requirements for multiple relief wells are primarily controlled by kill hydraulic requirements at the chosen kill point. Can the blowout be controlled with the selected casing design and pumping equipment using a single well? The required hydraulics calculated to regain control of the blowout may require more than one relief well. Consideration must be given to worst case scenarios using a single relief well, and include: maximum required hydraulic horsepower, maximum injection pressure, mud volumes and mud density, mud storage and transfer, loss of circulation after or during the kill, plug and abandonment options, super charging of shallow zones, multiple flow paths in the blowout wellbore and reservoir depletion while drilling the relief well.
Technical Risks to Evaluate
Kill Risk. Uncertainty in achieving a successful kill (or being substantially delayed) can be caused by various factors including:
Intersection Risk. Uncertainty in achieving a direct intersection (or being substantially delayed) can be caused by the following:
Consequences to Evaluate
HSE Consequences. This risk must be weighed against HSE hazards that are posed by the blowout every hour it is out of control that include e.g., ignition hazards, sour gas, pollution, health hazards, etc.
Economic Consequences. The economic consequences of the blowout must be evaluated every day it is out of control e.g., loss of hydrocarbon, reservoir damage, reservoir depletion, ignition damage, adjacent asset damage (surface property, wells, etc.), evacuation of third parties and control of exclusion zone (including roadways, railroads, etc), shutdown of adjacent production, loss of resources for other budgeted projects (human, equipment, rig, etc.), hydrocarbon contracts, pollution control and clean-up, adverse public reaction (stock price, partners, environmental groups, future business effects), lawsuits, regulatory fines, other knock-on economic effects both direct and indirect.
Evaluate Available Resources to Drill Multiple Relief Wells. If multiple relief wells are to be drilled the resources that are available to achieve the objectives must be carefully evaluated. This will require additional personnel, supervision, planning, and equipment, that if in limited supply, may actually reduce the probability of success of a single relief well that could be efficiently managed alone.
Evaluate the Cost to Drill Multiple Relief Wells. The cost to drill a second (or more) relief wells must then be evaluated against HSE and Economic Consequences. This is generally an economic risk decision. Will the increased cost of a second well out weigh the risk of possible long delays or loosing completely a single well? Historically, two redundant intervention projects going simultaneously and independently has generally proved sufficient. If a surface intervention is undertaken, and has a reasonable chance of success, then a single relief well may be adequate. If serious pollution or other environmental damage is being caused by the blowout, two relief wells might be considered regardless of the surface intervention plans. Risk analysis and risk management methods should be considered as a systematic approach to help make this decision.
In more recent years (last 12) most gas blowouts that were successfully controlled by relief wells were done with only a single relief well being started. This change from previous procedure of automatically starting two relief wells, is primarily due to technology improvements in ranging, surveying and directional drilling.
If two relief wells are to be started, the entire intervention strategy will change depending on how the second well is to be used (e.g., as an integral part of the kill, as a back up, or as a replacement for the blowout well. If it is possible to use the relief well as a replacement (a secondary objective) a different design may be necessary and should be investigated before hand.
 4.16 Kill equipment. Based on the hydraulic
calculations, kill equipment requirements vary with respect to the blowout scenario: The
critical factors are: (1) maximum pump rate; (2) maximum pump pressure; (3) pumping time
at peak loads; (4) maximum hydraulic horsepower (hhp) at peak loads; (5) various kill mud
densities required; (6) total mud volume of each density including reserves; (7) location
of high pressure pumping plant; (8) location of mud supplies; (9) mud transfer
requirements to feed high pressure pumps; (10) contingency equipment for reactive plug
storage and displacement, (11) cement volume and displacement rate requirements.
4.16 Kill equipment. Based on the hydraulic
calculations, kill equipment requirements vary with respect to the blowout scenario: The
critical factors are: (1) maximum pump rate; (2) maximum pump pressure; (3) pumping time
at peak loads; (4) maximum hydraulic horsepower (hhp) at peak loads; (5) various kill mud
densities required; (6) total mud volume of each density including reserves; (7) location
of high pressure pumping plant; (8) location of mud supplies; (9) mud transfer
requirements to feed high pressure pumps; (10) contingency equipment for reactive plug
storage and displacement, (11) cement volume and displacement rate requirements.
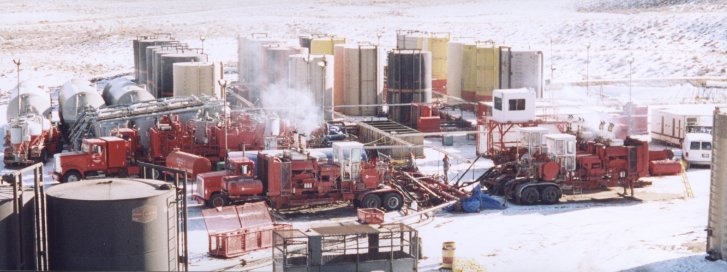 Planned pumping truck is HOWCO
76TF (1000 HHP) with 4.5" fluid ends (33’ x 8’ ea.). Pump rate maximum is
20 bpm @ 2500 psi. Will assume a nominal maximum rate of 15 bpm. Total numbers of trucks
will be four to achieve 60 bpm. Will plan space for five (5) trailers. If reservoir
depletion is lower than expected we can replace the 76TF with 2000 HHP Grizzly FPR-SJ
which will allow 10,000 hhp.
Planned pumping truck is HOWCO
76TF (1000 HHP) with 4.5" fluid ends (33’ x 8’ ea.). Pump rate maximum is
20 bpm @ 2500 psi. Will assume a nominal maximum rate of 15 bpm. Total numbers of trucks
will be four to achieve 60 bpm. Will plan space for five (5) trailers. If reservoir
depletion is lower than expected we can replace the 76TF with 2000 HHP Grizzly FPR-SJ
which will allow 10,000 hhp.
Click here to see kill plant layout
4.17 Directional equipment for 12-1/4" Hole.
4.18 Operations Organization. The Source Control Director for the project will be the VP-Operations for Black Oil INC. The Drilling Unit Leader will be the Drilling Manager for INC, the surface unit leader will be the field operations manager for INC, the HSE advisor will be the HSE manager for INC.
Relief Well Operations is divided into two functional groups one for routine drilling services and one for non-routine relief well special services. The routine services organization is called the Drilling Group. This group will coordinate all normal drilling activities for the relief well rig(s). The drilling manager will lead this group. This is a functional position, he will be responsible for assisting the Special Services Group, initially, in planning the relief well standard drilling program (e.g., casing design, wellheads, cement, drilling mud, bits, etc.). After the relief well is spudded he will coordinate all normal drilling activities between the relief well rig(s) and support the special services unit at the rig site.
The Senior Drilling Supervisor will be the Unit Leader for his rig. He will maintain most of his normal responsibilities during the drilling of the relief well. This will include all normal drilling operations, cementing, casing, logistics including well control and emergency response. If there is well control emergency on the relief well it will be his responsibility to carry out appropriate response actions (the relief well special services unit leader will provide emergency response guidelines before drilling begins).
The Relief Well Special Services Group is further divided into two units, the Intersection Unit and the Kill Unit, John Wright will lead this group and will report to the drilling manager. The Intersection Unit will coordinate the relief well intersection at the desired kill point on the blowout well, Jim Woodruff will lead this group. The Intersection Unit Leader will be responsible for making the intersection at the chosen kill point. He will supervise the directional drilling, surveying (surface and borehole), and the homing-in services. He will coordinate closely with the Rig Supervisor and the Drilling Group Leader to minimize mis-communication (the Intersection Unit Leader will have final decision on field procedures, for these services, if there are conflicts between service company personnel). The Intersection Unit Leader has three functional Task Force positions under him. They are: Directional Drilling Task Force Leader (Jim Woodruff), Surveying Task Force Leader (Steve Grindrod) and a Homing-in Task Force Leader (Vector Magnetics Engineer – Rhan Pitzer). These positions are functional with activities that must be addressed, however one individual may address more than one function depending on the scope of the intersection operations and the number of the relief wells drilled.
The Kill Unit Leader will plan (John Wright), coordinate and supervise: (1) the high pressure pumping plant design; (2) low pressure kill mud pumping, storage and transfer; (3) kill fluid design including any reactive chemicals or polymers usage; (4) obtaining hydraulic communication between the relief well and the blowout; (5) the kill pumping operations; (6) kill monitoring and diagnostics during pumping; (6) plug and abandonment. The Kill Unit Leader has five functional Task Forces under his supervision. These are: High Pressure Pumping; Low Pressure Pumping/Mud Storage and Transfer; Kill Cementing (HOWCO team leader); Kill Fluids (Baroid team leader); and Kill Modeling and Diagnostics (Ole Rygg). Click here to see top level orgchart.
Relief Well Branch- Special Services - Intersection Unit
The Special Services - Intersection Unit is shown in more detail in the following chart .The Special Services Group Leader acts as the special services project manager for the relief well. He will coordinating the Daily Planning Cycle, Incident Action Plans, the development of the General Plan and supervising its execution through the intersection, kill and P&A.
The Kill Unit Leader and the Intersection Unit Leader Positions are functional. The Special Services Unit Leader may fill one, both or neither of these positions depending on the scope of the kill operations and the number of the relief wells drilled and his personal experience.
The Intersection Unit Leader is a specialist in relief well type intersections with experience in all aspects of trajectory planning, directional drilling, surveying and homing-in. He is responsible for planning and supervising all intersection operations.
Below the Intersection Unit Leader are three functional Task Forces. One for Directional Drilling, one for Surveying and one for Homing-in. These units each have a Unit Leader positions. Someone must perform the function but they may or may not be separate individuals (e.g., the Intersection Unit Leader may also take on the role of Survey and Homing-in Task Force Leader positions). The size and critical nature of the project will dictate the filling of these positions with dedicated individuals.
The Directional Task Force Leader is a specialist in precision directional drilling peculiar to well intersection and homing-in requirements. Responsible for well placement as per plan. He will coordinate the directional drilling activities of the service company. This is best done through the contractors, directional drilling coordinator. If he is not available on a full time basis, the Task Force Leader will work directly with the DDS for each rig.
The Surveying Task Force Leader will coordinate all the surveying activities through the service company to include: MWD, drop magnetic multishots and gyros. He is a specialist in borehole position uncertainty and QA/QC of the surveying instruments being used. He is responsible for survey accuracy in the blowout and all relief wells. The coordination is best done through the contractor’s MWD and survey coordinator. If this person is not available full time he will coordinate directly with the operators.
The Homing-in Task Force Leader is a specialists in casing detection tools, their application and QA/QC of data. He will coordinate with the homing-in service company to design the ranging depths, procedures, relative well trajectories and uncertainty of calls. This position is again functional and might be filled by the Survey Task Force Leader or the Intersection Unit Leader if they are qualified.
Relief Well Branch- Special Services - Kill Unit
The Kill Unit is shown in more detail in the following figure. The Kill Unit Leader is an engineering specialist in planning, preparing for and directing the kill operation from either the surface or from a relief well. The Kill Unit is shown as a single group for both Surface Control and Relief Well as it is not common for both teams to working simultaneously on both (there generally are not enough resources set up kill spreads on two relief wells and a surface kill operation). Kills are usually planned in sequences (e.g., if a surface kill is possible, several attempts may be tried before resorting to the relief wells). It may be necessary, however, in cases where drilling is fast, that separate task forces may have to mounted.
The Kill Unit is further divided into specific functional Task Forces. These Task Forces may or may not require dedicated Leaders depending on the circumstances and scope of the kill job (i.e., the Kill Unit Leader may fill one or more of the Task Force Leader positions). The Task Force functions are:
High pressure pumping Task Force. This group will be responsible for planning, assembling, testing and performing the high pressure kill pumping (based on simulated hhp requirements). This may require resources from more than one service company and they may have to be split between kill platforms or rigs. The Task Force Leader, if activated, must be a specialist in this field. If more than one service company is utilized he should be independent if possible.
Low pressure pumping, mud storage, mud transfer, and mud plant design/construction (if necessary) Task Force. This group will be responsible for planning, assembling, testing and performing the low pressure kill fluid storage and pumping to feed the high pressure pumping plant. If liquid mud is not available then this team will also be responsible for design and construction of a suitable mud plant. This may require resources from more than one service company and they may have to be split between kill platforms or rigs. The Task Force Leader, if activated, must be a specialist in this field. If more than one service company is utilized he should be independent if possible.
Kill Fluid Task Force. This group will be responsible for designing the kill fluid(s) and their recipes to be used. This will include: water, brines, mud, additives, LCM, special chemicals, polymers, and reactive chemicals (e.g., gunk). The Task Force Leader, if activated, must be a specialist in this field. If more than one service company is utilized he should be independent if possible.
Kill Cementing Task Force. This group will be responsible for designing the kill cement(s) and their recipes to be used; equipment selection and testing and performing the kill cementing. This may require resources from more than one service company and they may have to be split between kill platforms or rigs. The Task Force Leader, if activated, must be a specialist in this field. If more than one service company is utilized he should be independent if possible.
Kill Simulation and Monitoring Task Force. This group is responsible for: performing hydraulic simulations (using sophisticated software tools); assisting in blowout diagnostics; monitoring the kill during the job providing feed back as required to the Kill Unit Leader; performing diagnostics if the kill attempt failed for modifications to the next attempt.